Project case study
HydroWatch
An IoT flood-monitoring project for the Municipal Disaster Risk Reduction and Management Office (MDRRMO), bringing field measurements into map and dashboard views.
- Client context
- MDRRMO
- Data
- Rainfall · Water levels
- Core stack
- Arduino · APIs · PHP · MySQL
The Problem
Monitoring teams need a way to see changing rainfall and water levels across field locations, together with measurement times and warning levels.
My Contribution
I developed the connected monitoring system and the web views that make field readings accessible for monitoring and response coordination.
From Sensors to Dashboard
Arduino-based field devices send measurements through an API to a PHP/MySQL backend. The web interface organizes the stored readings by monitoring location and time.
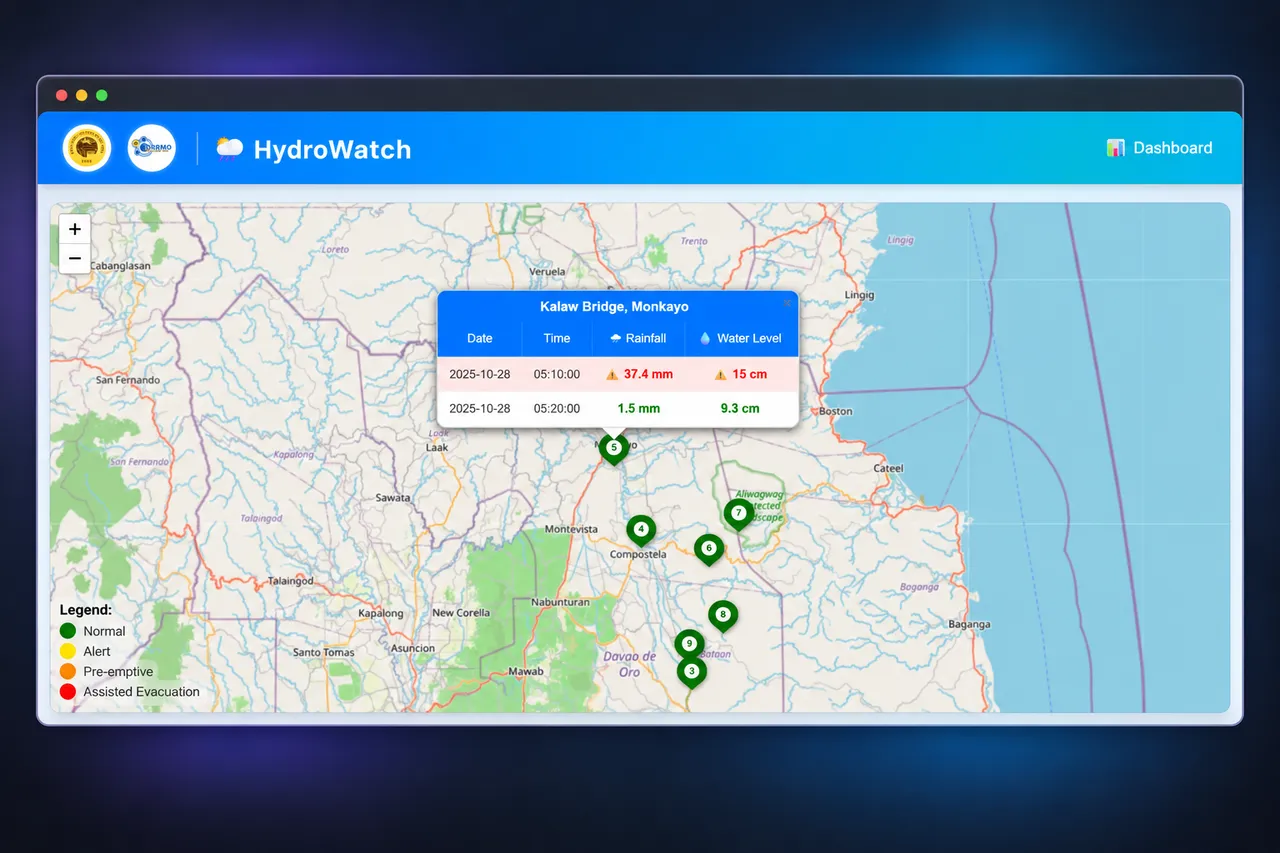
- Map view: locate monitoring stations and inspect rainfall and water levels.
- Dashboard and reports: compare timestamped readings across locations.
- Warning states: normal, alert, pre-emptive, and assisted evacuation.
- Automatic alerts when water levels rise.
What Was Delivered
A monitoring workflow that connects physical measurements with web-based maps, reports, and alerts.
Deployment and Access
The operational application is not linked publicly. The screenshots demonstrate interface capabilities without publishing login details or direct access to the monitoring system.
Map attribution: OpenStreetMap contributors (opens in a new tab).
Have a Similar Challenge?
Tell me what you need to build, your preferred timeline, and where you need help.
Discuss an IoT Monitoring Project